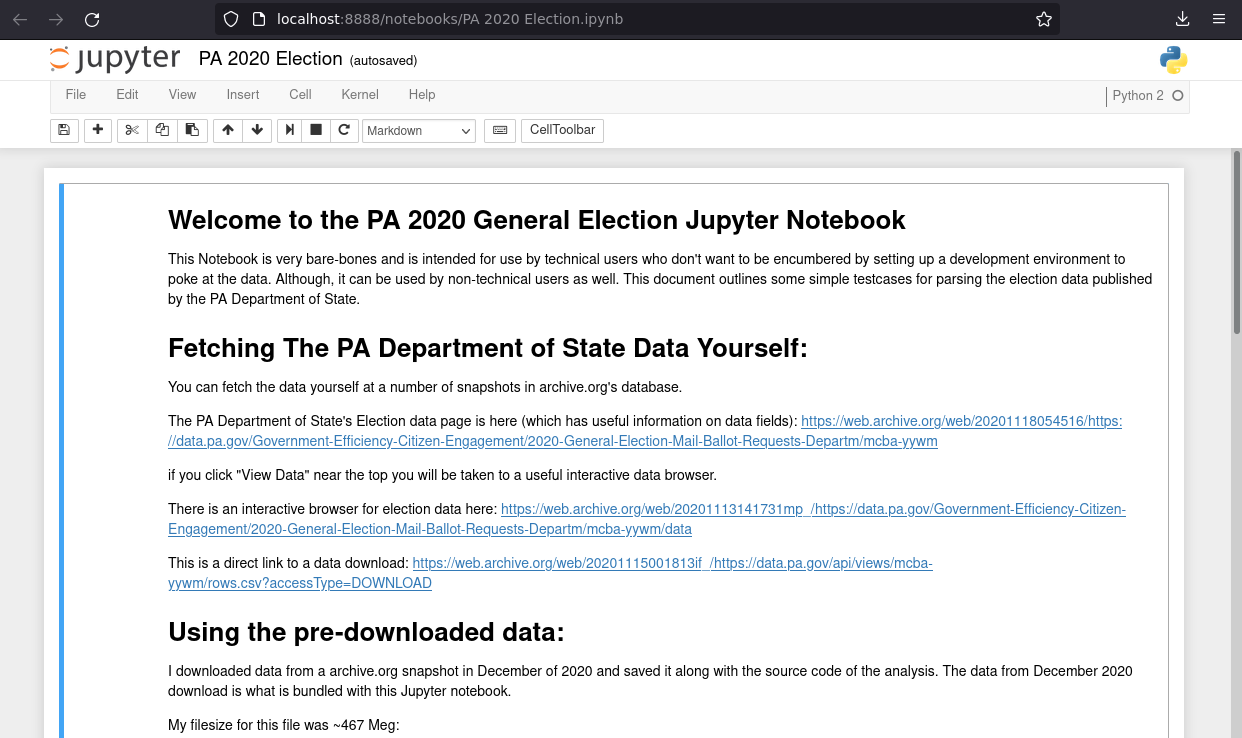
For those who want to “see for themselves”.
Downloading the data manually
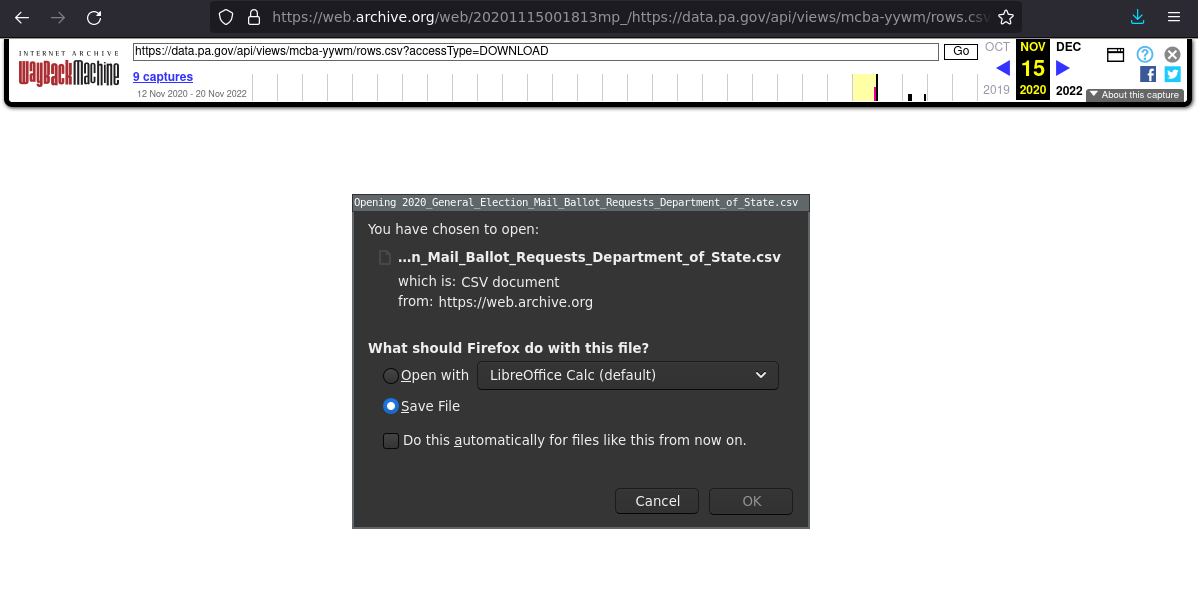
The simplest way to view the data is to download the raw data directly and view it in Excel or OpenOffice (or some similar tool).
You can download the full CSV data directly at this link or others like it in the archive.org snapshots: https://web.archive.org/web/20201115001813if_/https://data.pa.gov/api/views/mcba-yywm/rows.csv?accessType=DOWNLOAD
What the data looks like
…in a text editor like Notepad.

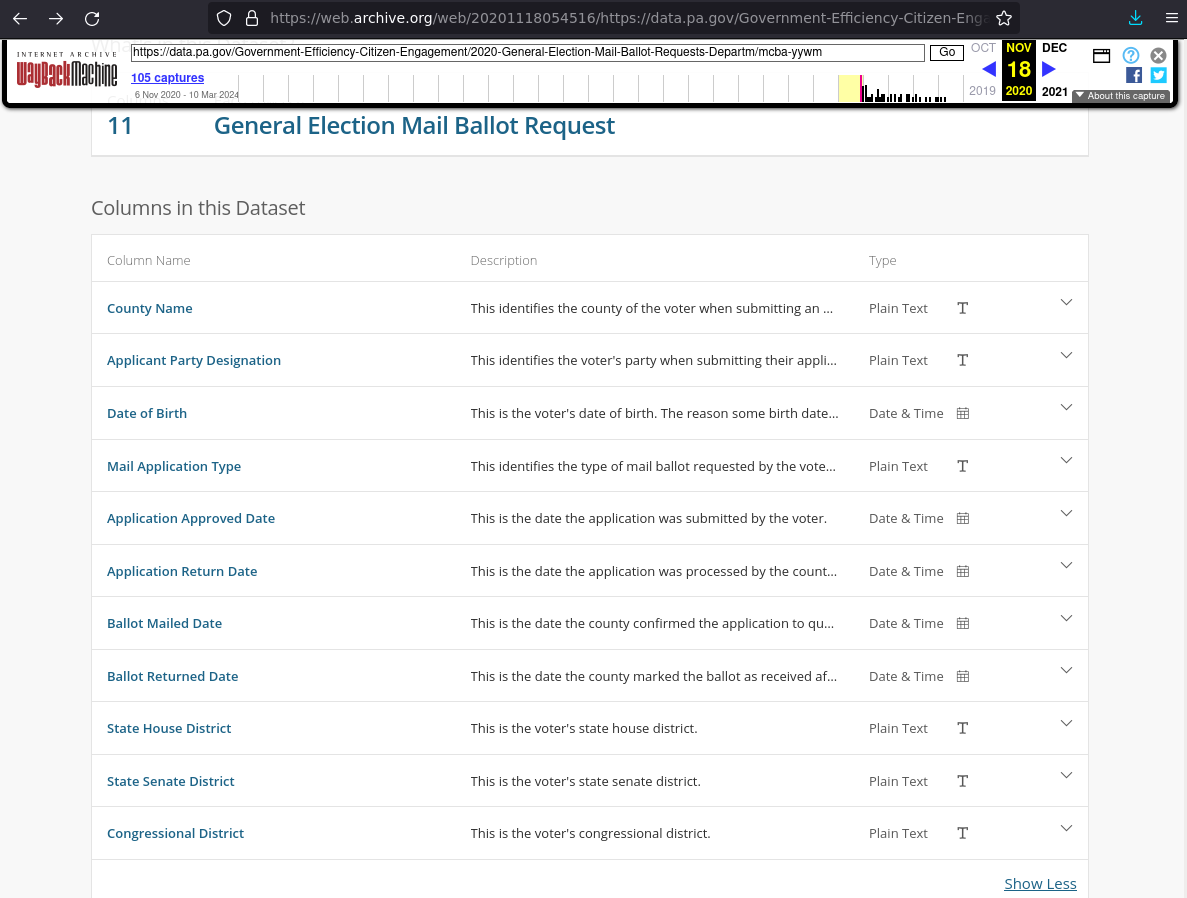
Be sure to read the descriptions of the data fields
For example, the Date of Birth January 1st 1800 occurs in the dataset. It may be alarming to you initially, but the field descriptions explain that this is a “protection” for certain voters (like the victims of domestic violence). In all, I only counted ~60 of these.

Using the PAOpendata viz in your browser
The second easiest way to view the data is using the PA OpenData visualization tool in your web browser. It offers some user-friendly sorting, querying, and graphing functions. The original PAOpenData link is here: https://data.pa.gov/Government-Efficiency-Citizen-Engagement/2020-General-Election-Mail-Ballot-Requests-Departm/mcba-yywm
You can see all of Archive.org’s snapshots of the PAOpenData site here:
https://web.archive.org/web/20240000000000*/https://data.pa.gov/Government-Efficiency-Citizen-Engagement/2020-General-Election-Mail-Ballot-Requests-Departm/mcba-yywm
Here is a specific snapshot:
Click “View Data” near the top.
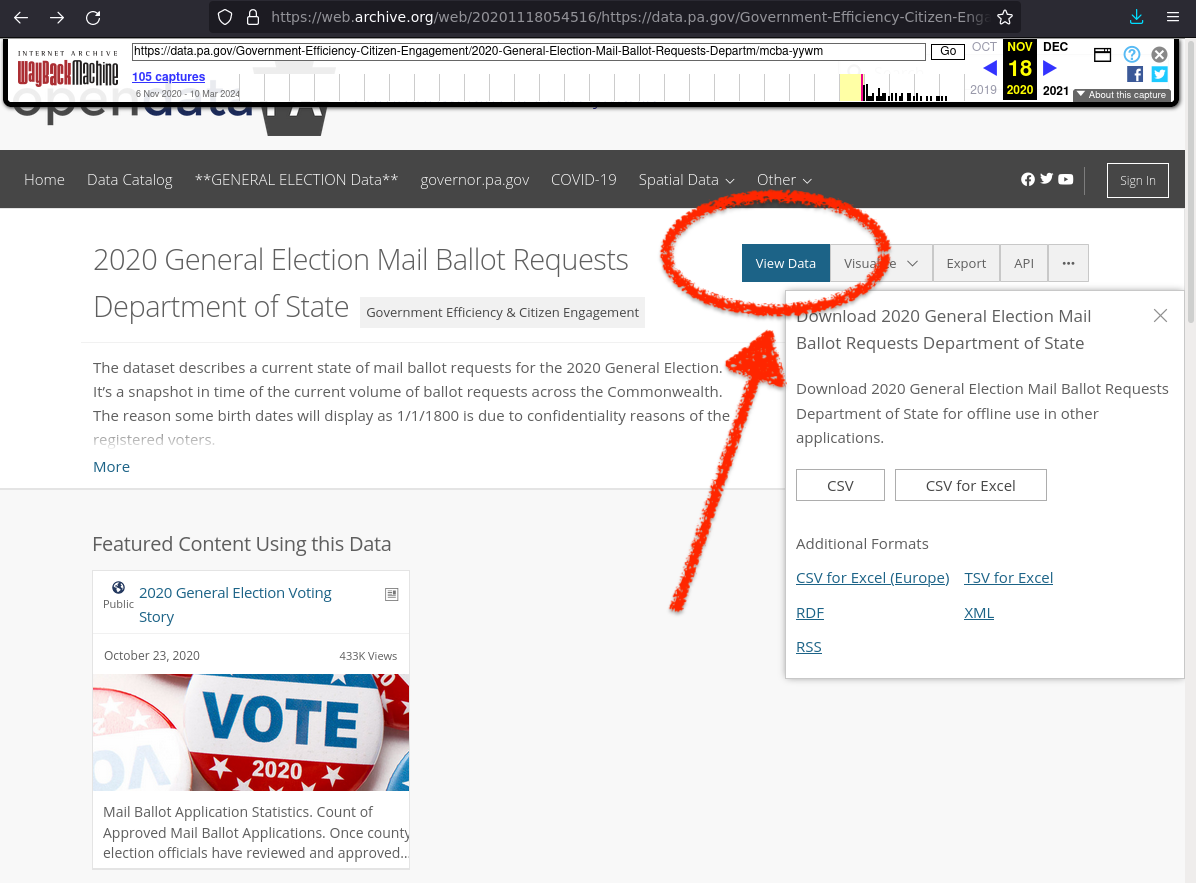
NOTE: keep in mind this is Archive.org’s archive of the site, so it may take a long time to load in your browser.
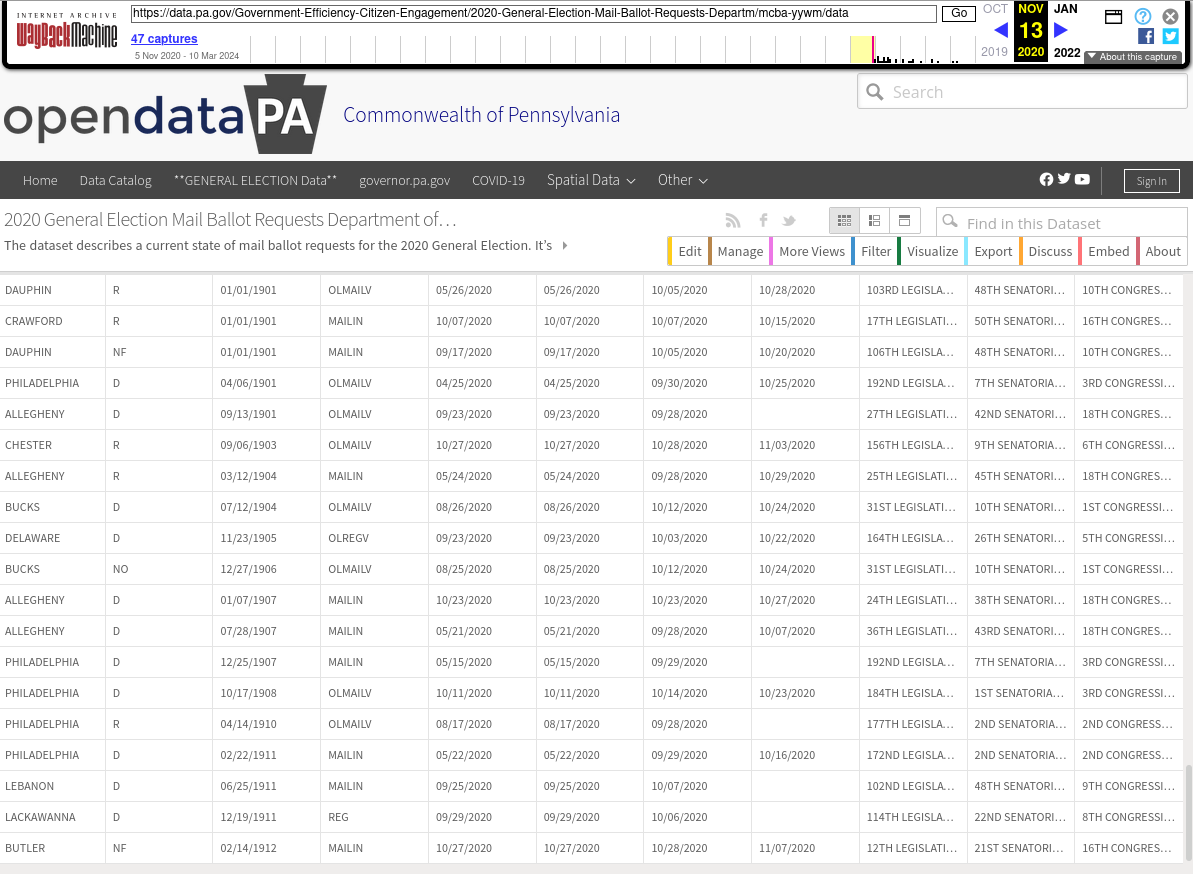
After loaded it will look like this:
Running the Docker container:
The Docker container contains the code I wrote to explore the dataset. It is self-contained and has all the dependencies already installed. This will allow you to immediately get to work tinkering with the data and writing your own code if you are so inclined. It is the same code that was used to generate the screenshots in the main writeup.
It also contains a sampling of the data itself, but you can download the data yourself also and use that.
Tools Used:
- Jupyter Notebooks
- Python
- Pandas
- PyTorch
- Matplotlib (only for heatmaps and scatterplots not shared in this post)
How to run the Docker container
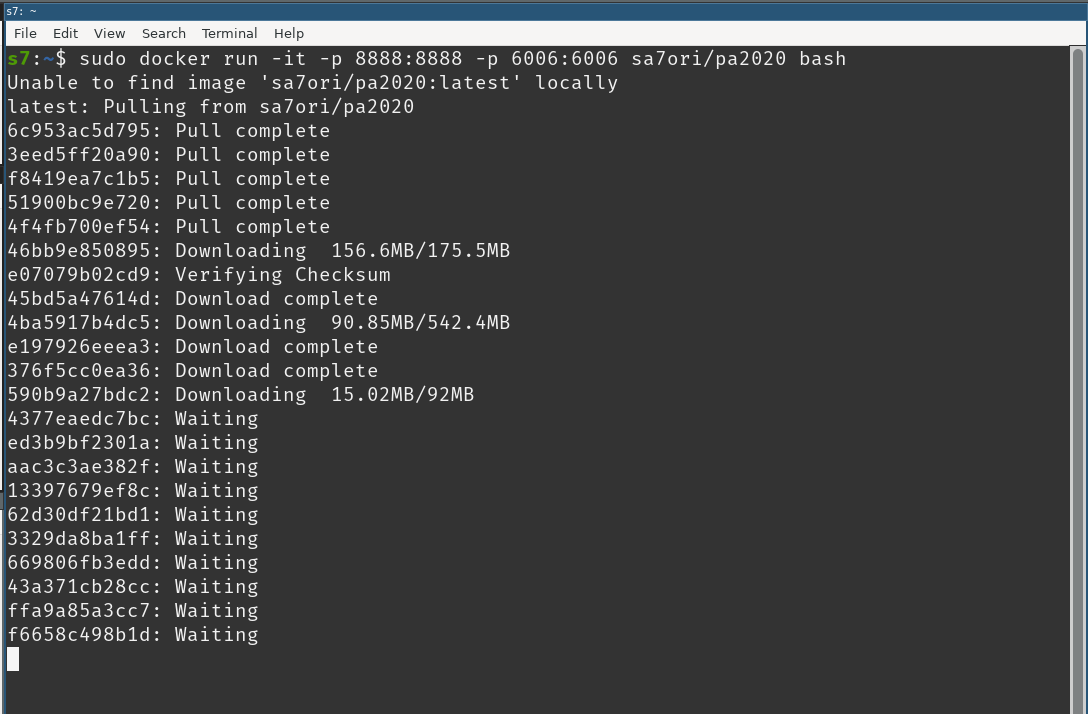
docker run -it -p 8888:8888 -p 6006:6006 sa7ori/pa2020 bash
It will automatically download the container:
 Once download is complete, the container will run and drop you into a rootshell:
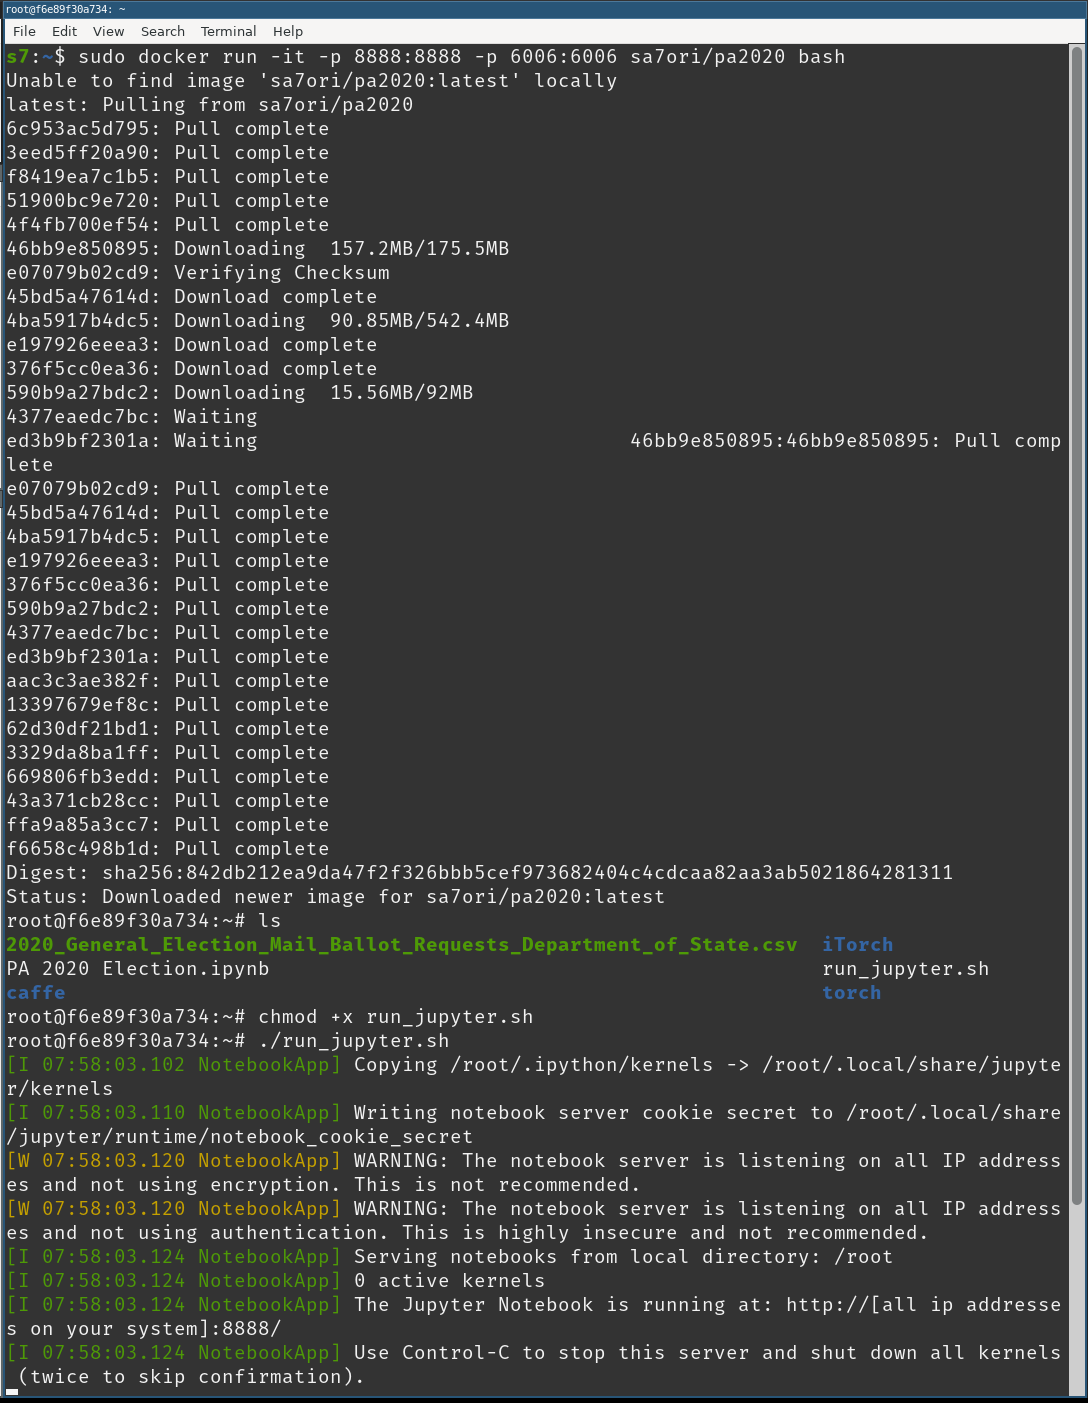 Run the
 run_jupyter.sh shell script
Open your browser to: http://localhost:8888 and click on the PA 2020 Notebook
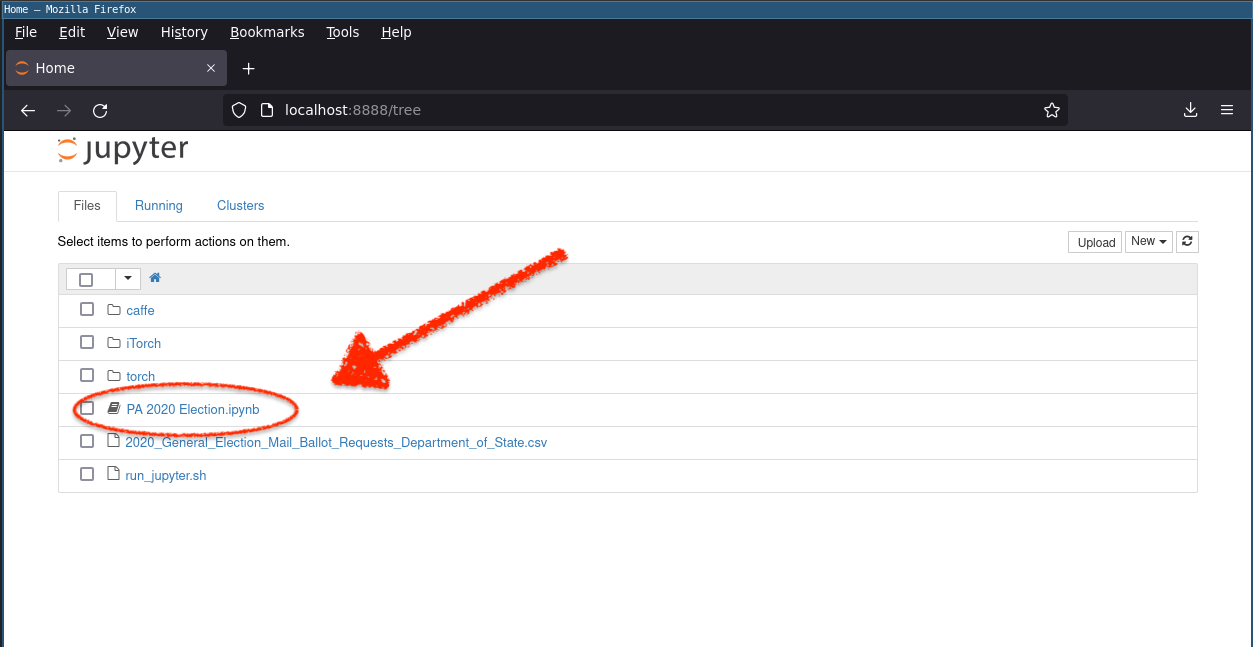 You are now in control:
